Intermodal Transportation: Combining Rail and Truck for Maximum Savings
Your 2,000-mile shipment from Los Angeles to Chicago costs $3,200 by truck. Put that same container on rail for the long haul, with trucks handling only the first and last 100 miles, and the cost drops to $2,100.
That’s 34% savings. Not 3%. Not 10%. Thirty-four percent.
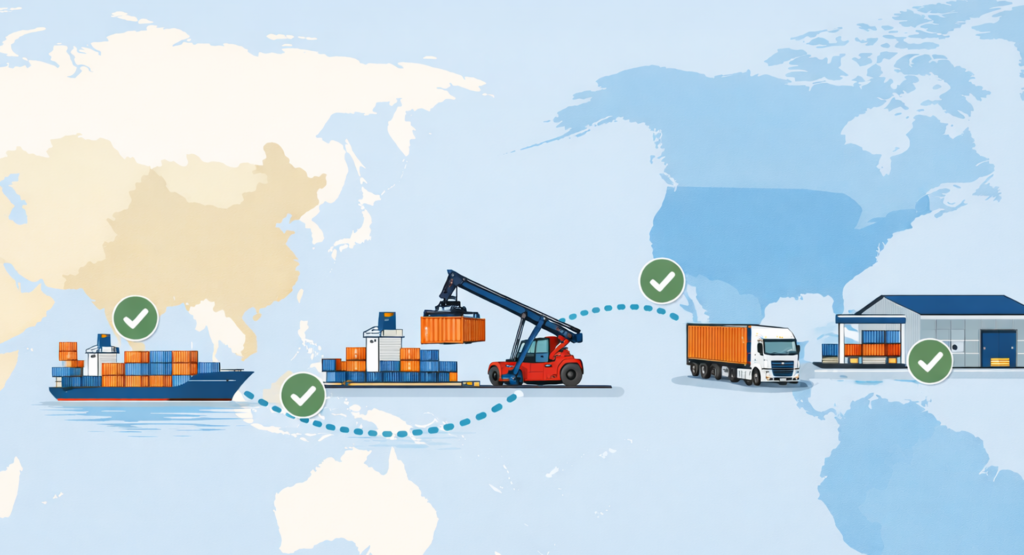
Intermodal transportation combines the cost efficiency of rail for long distances with the flexibility of trucks for pickup and delivery. One container moves seamlessly across both modes without touching the freight inside. Rail handles the heavy lifting across the country. Trucks provide the door-to-door service rail can’t deliver.
But intermodal isn’t just about cost. It’s increasingly about sustainability. One rail car carries the freight of 3-4 trucks while producing 75% less carbon emissions per ton-mile. Companies facing pressure to reduce their carbon footprint are discovering that intermodal delivers both environmental and financial benefits simultaneously.
The challenges? Intermodal requires longer transit times than direct truck. It works best for lanes exceeding 750 miles where rail efficiency overcomes the added time for container transfers. Equipment availability fluctuates with market conditions. And not every shipment fits the intermodal model—you need consistent volume and freight that can tolerate the additional 1-2 days in transit.
Yet shippers mastering intermodal consistently achieve 20-40% cost reductions on suitable lanes while meeting corporate sustainability targets that pure truck operations cannot match. The key is understanding which freight fits intermodal economics, how to work with drayage partners and rail providers, and when truck remains the better choice despite higher costs.
The intermodal opportunity isn’t theoretical. The infrastructure exists. The service providers operate nationwide. The cost savings are real and immediate. What’s missing is often just the knowledge of how to use intermodal effectively.
Table of Contents
- Why Intermodal Saves Money
- How Intermodal Actually Works
- Equipment Types and Container Options
- Determining Lane Stability
- Understanding Drayage Operations
- Working with Rail Service Providers
- Sustainability and Carbon Reduction Benefits
- Managing Transit Time Expectations
- Building Your Intermodal Strategy
- Making Intermodal Work for Your Business
Why Intermodal Saves Money
The cost advantage of intermodal stems from fundamental economic differences between rail and truck transportation over long distances.
Fuel efficiency gives rail its primary cost advantage. Trains move freight 3-4 times more fuel-efficiently than trucks per ton-mile. This efficiency comes from steel wheels on steel rails creating far less friction than rubber tires on pavement, plus the ability to move multiple containers in a single train.
When diesel prices rise, this efficiency advantage grows. When fuel costs moderate, the advantage shrinks but remains substantial. The relationship between truck and intermodal pricing tracks diesel costs closely.
Labor economics favor rail for long hauls. One train crew moves 200+ containers across the country. That same freight by truck requires 200+ drivers, each entitled to wages, benefits, and hours-of-service rest requirements. Rail spreads labor costs across massive volume while trucks apply labor costs to individual moves.
Driver shortage impact makes truck capacity scarce and expensive. Rail doesn’t face the same labor shortage pressures because one crew handles vastly more freight. This capacity abundance typically translates to better pricing stability in intermodal versus truck markets.
Asset utilization advantages come from trains operating continuously across long distances without the stops, breaks, and downtime that limit truck productivity. A container on rail moves 24 hours daily. A truck driver must rest, creating downtime that increases per-mile costs.
But intermodal isn’t cheaper for everything everywhere. Short distances don’t allow rail efficiency to overcome the added costs of container handling and drayage moves. The breakeven distance where intermodal beats truck typically falls around 750 miles—less than that and truck usually wins on total cost.
The cost advantage grows with distance. At 1,000 miles, intermodal might save 20%. At 2,000 miles, savings often reach 30-40%. At 2,500+ miles, the advantage can exceed 50% depending on lane and market conditions.
Volume consistency improves intermodal economics through committed contracts that lock in capacity and pricing. Shippers moving containers regularly on specific lanes negotiate better rates than those shipping sporadically. Rail providers reward volume commitment because it enables efficient network planning.
How Intermodal Actually Works
Understanding intermodal operations helps shippers use the service effectively and set realistic expectations.
The basic flow follows this pattern:
- Origin drayage: A dray truck picks up an empty container from an intermodal ramp or equipment depot, delivers it to your loading location, waits while you load (or returns later for a loaded container), then delivers the loaded container to the rail ramp.
- Rail ramp operations: The container gets lifted from the chassis onto a railcar using massive cranes or reach stackers. Multiple containers from various shippers get loaded onto the same train.
- Rail line-haul: The train moves containers across the country, typically traveling 500-700 miles per day. Containers may transfer between trains at intermediate rail yards depending on routing.
- Destination rail ramp: The container gets unloaded from the railcar onto a chassis at the destination intermodal ramp.
- Destination drayage: A dray truck picks up the container and delivers it to the final destination, waits while you unload (or returns later for the empty), then returns the empty container to a designated depot or ramp.
Each step involves specific processes, timing windows, and coordination requirements.
Container availability at origin determines when you can actually ship. Unlike truck where you call a carrier and they dispatch a truck, intermodal requires an available container at the origin ramp. During peak seasons or equipment shortages, container availability can delay shipments.
Cut times at rail ramps dictate when containers must arrive to make specific train departures. Miss the cut time by even 15 minutes and your container waits for the next train—potentially 24-48 hours later depending on service frequency.
Transit time variability exceeds truck shipping. While trucks might deliver in 3-4 days coast-to-coast with some predictability, intermodal typically takes 5-7 days with more variability depending on train schedules, rail congestion, and weather impacts.
Tracking capabilities have improved dramatically but still don’t match truck visibility. You’ll know when containers leave origin ramps, arrive at destination ramps, and get delivered. But you may not have precise real-time location updates during rail transit like you’d expect with truck freight.
Equipment control differs from truck shipping. The container belongs to the steamship line or intermodal provider—not you. You can’t hold equipment indefinitely. Free time for loading/unloading typically ranges from 2-4 days, after which per-day storage charges apply. These charges escalate quickly, potentially eliminating cost savings if you can’t load or unload promptly.
Equipment Types and Container Options
Intermodal equipment comes in specific sizes and types that determine what freight you can move and how efficiently.
Standard container sizes:
53-foot domestic containers dominate intermodal shipping in North America. These containers match standard truck trailer lengths and provide maximum cubic capacity. Most intermodal freight moves in 53-foot equipment.
40-foot containers see limited use in domestic intermodal but remain common for international shipments transitioning to domestic rail. They offer less capacity than 53-foot equipment but provide compatibility with international shipping.
Container height options include standard (8’6″) and high-cube (9’6″) configurations. High-cube containers provide 13% more cubic capacity—valuable for light, bulky freight that cubes out before reaching weight limits.
Weight limits typically max out at 42,000-44,000 pounds for loaded containers. This limit reflects railcar capacity and the need to maintain total train weight within railroad operating parameters. Compare this to truck weight limits of 45,000 pounds for trailer+freight, and the weight capacity difference is minimal.
Specialized equipment serves specific freight types:
Refrigerated containers maintain temperature control for produce, pharmaceuticals, and other temperature-sensitive freight. These units operate independently on generator power during rail transit and plug into external power at origin and destination.
Flatbed intermodal equipment carries freight too large for enclosed containers. These specialized railcars handle dimensional cargo that wouldn’t fit in standard containers.
Chassis requirements complicate equipment logistics. Containers need chassis (wheeled frames) for road transport during drayage moves. Chassis availability, condition, and associated per-diem charges represent an often-overlooked cost and complexity in intermodal operations.
The industry uses gray pool chassis shared across multiple users rather than carrier-specific chassis. This pooling improves efficiency but creates dependency on chassis availability at specific locations.
Container condition varies significantly. Inspect containers before loading. Floor damage, wall holes, door problems, and moisture intrusion can damage freight. Unlike owning your own trailers where you control condition, intermodal means accepting whatever container gets assigned.
Most providers offer premium equipment options at higher costs for shippers requiring guaranteed equipment quality or specific features.
Determining Lane Suitability
Not every shipment fits intermodal economics. Knowing which lanes work helps focus intermodal usage where it delivers maximum value.
Distance thresholds determine intermodal viability. The conventional wisdom suggests 750+ miles as the minimum distance where intermodal costs compete with truck. Below 750 miles, the drayage costs and rail handling fees overwhelm fuel savings.
But this threshold isn’t absolute. Some lanes work at 650 miles. Others need 900+ miles to break even. Factors include:
- Specific truck market rates in that lane
- Rail service frequency and competition
- Drayage costs at both ends
- Current diesel prices
Volume consistency improves intermodal economics through contracted capacity and negotiated rates. Lanes moving multiple containers weekly justify the relationship investment and enable committed capacity that improves reliability.
One-off shipments pay higher rates and face more service variability than consistent volume lanes.
Transit time tolerance limits intermodal applicability. If customers demand 3-day delivery coast-to-coast, intermodal’s 5-7 day transit doesn’t work regardless of cost savings. Match intermodal to freight where the additional transit time is acceptable.
Freight characteristics affect intermodal suitability:
High-density freight maximizes intermodal value. If you’re moving 40,000+ pounds in a container, you’re utilizing rail’s weight capacity fully while truck would carry the same load at higher cost.
Low-density freight may cube out the container before reaching weight limits, reducing efficiency. A container carrying 15,000 pounds because freight is bulky doesn’t fully utilize intermodal’s capacity advantage.
Freight value relative to transit time matters. High-value freight where each day in transit represents significant inventory carrying costs may not suit intermodal’s longer transit. Commodity products with lower time sensitivity work perfectly.
Loading/unloading capability at your facilities determines intermodal feasibility. Can you load and unload containers within the free time allowed (typically 2-4 days)? Do you have dock height access or need the container dropped for ground-level loading?
Facilities lacking the ability to load/unload containers within free time face per-diem charges that eliminate cost savings.
Seasonal patterns in truck market rates affect intermodal competitiveness. During soft truck markets, truck rates may drop enough that intermodal’s cost advantage disappears. During tight capacity, intermodal’s advantage grows as truck rates spike while rail pricing remains more stable.
Understanding Drayage Operations
Drayage—the truck moves at the beginning and end of intermodal shipments—represents a critical and often problematic component of intermodal operations.
Drayage is not regular trucking. Dray carriers specialize in short hauls between rail ramps and customer locations. They operate differently than long-haul carriers, with different equipment, different scheduling, and different service expectations.
Dray rates typically get quoted as flat fees per container move rather than per-mile rates. Common dray move ranges include:
- Under 20 miles: $200-$300 per container
- 20-50 miles: $300-$500 per container
- 50-100 miles: $500-$800 per container
These rates fluctuate with local market conditions, fuel prices, and capacity availability.
Scheduling dray moves requires more advance notice than truck freight. Dray carriers need 24-48 hours to schedule pickups and deliveries. Same-day or next-day service is rare and expensive. Plan accordingly.
Street turns optimize drayage efficiency and reduce costs. Instead of returning an empty container to the ramp after unloading, the dray carrier takes it directly to another customer for loading. This “street turn” saves a ramp return move, reducing both cost and time.
Intermodal providers and dray carriers offer incentives for street turns—typically $50-$150 per container. If your shipping lanes support matching empty returns with new loads, street turns generate immediate savings.
Dray capacity constraints vary by market. Major intermodal hubs like Chicago, Los Angeles, and Atlanta typically have ample dray capacity. Secondary markets may have limited dray options, creating service challenges and higher costs.
Chassis splits complicate drayage when the container and chassis come from different pools. Dray carriers may need to visit multiple locations to pick up chassis and container separately, adding time and cost.
Free time management requires careful attention. Containers sitting at customer locations beyond free time (usually 2-4 days) accumulate per-diem charges of $75-$150 daily. These charges accelerate after the initial grace period expires.
Load and unload promptly. If you can’t load/unload within free time, negotiate extended free time with your intermodal provider before the container arrives—not after charges start accumulating.
Live load/unload means the dray driver waits while you load or unload the container. This service costs extra ($50-$150 per hour) but enables faster container turns. Most shippers use drop-and-hook where the dray carrier drops the container and returns later for pickup.
Working with Rail Service Providers
The intermodal market includes several types of service providers, each offering different value propositions and service models.
Class I railroads (Union Pacific, BNSF, CSX, Norfolk Southern, CN, CP) own the rail infrastructure and operate the trains. They sell intermodal services directly but also work through intermediaries.
Direct relationships with Class I railroads work for large-volume shippers moving thousands of containers annually. These relationships provide access to committed capacity, competitive pricing, and direct communication about service issues.
Smaller shippers typically work through intermediaries rather than directly with railroads.
Intermodal Marketing Companies (IMCs) act as intermediaries between shippers and railroads. Major IMCs like Hub Group, JB Hunt Intermodal, and Schneider Intermodal purchase capacity from railroads in bulk, then resell it to shippers while managing drayage and customer service.
IMCs provide several advantages:
- Simplified contracting with one provider covering entire intermodal moves
- Integrated drayage coordination
- Single point of contact for service issues
- Access to rail capacity without direct railroad relationships
- Flexibility to work across multiple railroad networks
Freight brokers increasingly offer intermodal services alongside truck brokerage. They use IMCs or direct rail relationships to provide intermodal options when appropriate for customer shipments.
Intermodal container leasing companies (DCLI, Flexi-Van, Direct ChassisLink) own equipment that railroads and IMCs use. You typically don’t contract directly with leasing companies, but they’re part of the equipment ecosystem affecting availability and costs.
Service level options vary by provider:
Premium services guarantee transit times and equipment quality for higher prices. These services suit time-sensitive freight where intermodal’s typical transit variability is unacceptable.
Standard services offer good transit times at lower cost but without guarantees. Most intermodal freight moves on standard service.
Economy services provide the lowest rates with the longest transit times and most variability. These services work for freight where cost matters more than speed.
Contract structures determine pricing, capacity access, and service commitments. Options include:
Committed capacity contracts guarantee container availability and competitive pricing in exchange for volume commitments. These contracts suit shippers with consistent intermodal volume.
Spot market intermodal provides flexibility without commitments but typically costs 15-30% more than contracted rates. Capacity during peak seasons may be limited.
Sustainability and Carbon Reduction Benefits
Intermodal transportation delivers measurable environmental benefits that increasingly factor into corporate transportation decisions.
Carbon emissions per ton-mile for rail average 75% lower than truck transportation. This dramatic difference stems from rail’s fuel efficiency and the ability to move multiple containers per train.
For a coast-to-coast shipment (approximately 2,800 miles), the carbon footprint comparison looks like this:
- Truck: ~1,800-2,000 pounds of CO2 emissions
- Intermodal: ~450-550 pounds of CO2 emissions
That 70-75% reduction applies to every container you shift from truck to intermodal.
Sustainability reporting requirements are driving intermodal adoption among companies with carbon reduction commitments. Many large corporations have committed to reducing Scope 3 emissions (which include transportation) by 30-50% by 2030-2035.
Shifting freight from truck to intermodal provides one of the easiest and most cost-effective paths to achieving these reductions while actually saving money rather than requiring premium payments for green alternatives.
ESG investor pressure makes carbon footprint reduction a competitive advantage. Companies demonstrating meaningful emissions reductions attract investment and customer loyalty. Transportation carbon reduction through intermodal provides documentable, measurable results.
Customer preferences increasingly favor companies demonstrating environmental responsibility. B2B customers particularly scrutinize suppliers’ sustainability practices. Intermodal usage provides concrete evidence of carbon reduction commitment.
Regulatory trends point toward carbon taxation or cap-and-trade systems for transportation emissions. Early adopters of intermodal position themselves favorably if such regulations emerge, while companies dependent on pure truck face future cost increases.
Air quality benefits extend beyond carbon emissions. Trains produce dramatically lower levels of nitrogen oxides (NOx) and particulate matter than trucks. These pollutants contribute to urban air quality problems and health impacts.
Highway congestion reduction represents an indirect benefit. Every container moved by rail removes a truck from highways, reducing congestion that costs the economy billions annually through delays and wasted fuel.
Calculate your emissions savings using the EPA’s SmartWay freight emissions calculator or similar tools. Document baseline emissions from truck movements, then calculate reductions after shifting to intermodal. These calculations support sustainability reporting and demonstrate progress toward corporate climate goals.
Managing Transit Time Expectations
Transit time represents intermodal’s primary service trade-off versus truck. Understanding and managing these expectations determines intermodal success.
Typical transit times for major lanes:
- Los Angeles to Chicago: 5-6 days (vs. 2-3 days truck)
- Los Angeles to New York: 7-8 days (vs. 4-5 days truck)
- Seattle to Chicago: 5-6 days (vs. 3-4 days truck)
- Chicago to Atlanta: 3-4 days (vs. 2 days truck)
Notice the pattern: intermodal adds 1-3 days versus truck. This additional time comes from container handling at ramps, train schedules, and rail network routing.
Variability exceeds truck reliability. While truck shipments might deliver within a 1-day window 90% of the time, intermodal typically delivers within a 2-day window 85% of the time. Weather, rail congestion, equipment issues, and network delays create more variability than direct truck.
Schedule predictability improves with experience on specific lanes. After running 20-30 shipments in a lane, you’ll understand typical transit patterns and can set realistic customer expectations.
Service upgrades provide faster, more reliable transit for premium pricing. Premium intermodal services offer:
- Guaranteed transit times
- Penalty payments for late delivery
- Priority loading and routing
- Enhanced tracking
These premium services narrow the gap with truck service at costs still below truck rates.
Strategic inventory positioning accommodates longer intermodal transit. Increase safety stock by 1-2 days’ worth of inventory to buffer the longer transit time. The increased inventory carrying cost is typically dwarfed by transportation savings.
For example: If intermodal saves $1,000 per container and you run 100 containers monthly, that’s $100,000 monthly savings or $1.2 million annually. If you need an extra $50,000 in safety stock to buffer the longer transit, the payback period is under 2 weeks.
Customer communication prevents service complaints. Explain that certain freight moves by intermodal with longer but predictable transit times. Most customers accept slightly longer delivery windows when they understand timing in advance and receive reliable service.
Order lead time management extends order cut-off times when using intermodal. If truck delivery takes 3 days and you now use 6-day intermodal transit, move order cut-offs 3 days earlier to maintain the same delivery dates.
Building Your Intermodal Strategy
Successfully implementing intermodal requires systematic analysis, provider selection, and operational integration.
Lane analysis starts by identifying candidates for intermodal conversion. Review your freight movements and filter for:
- Distance over 750 miles
- Regular, recurring shipments (weekly or more frequent)
- Full container volumes (no LTL shipments)
- Transit-tolerant freight (can accept additional 1-3 days)
These criteria identify your best intermodal opportunities.
Cost modeling compares total costs including:
- Rail line-haul rates
- Origin and destination drayage
- Accessorial charges (chassis, per diem, fuel surcharges)
- Total intermodal cost vs. current truck costs
Don’t just compare line-haul rates—total landed cost determines true savings.
Provider selection should consider multiple options. Get quotes from 2-3 IMCs or direct rail relationships. Compare not just pricing but service reliability, claims experience, and communication quality.
Test lanes before full commitment. Start with 1-2 lanes moving modest volume. Learn the service characteristics, identify operational issues, and build confidence before expanding.
Equipment logistics require planning for:
- Empty container pickup and positioning
- Loading schedules that meet rail cut times
- Destination delivery coordination
- Empty container return
Each step needs coordination between your facilities, dray carriers, and rail providers.
Tracking and visibility systems should integrate intermodal shipment data into your TMS or order management systems. Customers and internal teams need visibility to intermodal shipments just like truck freight.
Performance measurement tracks key metrics:
- On-time delivery percentage
- Cost per container vs. truck alternative
- Equipment availability and delays
- Claims and damage rates
- Customer satisfaction with transit times
These metrics guide expansion decisions and provider performance management.
Continuous optimization expands intermodal usage to additional lanes as you gain experience and confidence. Most shippers start with 5-10% of freight on intermodal, then expand to 20-30% or more as operations mature
Making Intermodal Work for Your Business
Intermodal transportation provides one of the few opportunities in logistics where you can simultaneously reduce costs and improve sustainability performance. The 20-40% cost savings on suitable lanes are real, documented, and achievable by companies of virtually any size shipping freight across the country.
But intermodal isn’t automatic success. It requires understanding the operational differences from truck shipping, selecting appropriate lanes, working effectively with drayage providers and rail services, and managing the transit time trade-off that intermodal requires.
The companies succeeding with intermodal share common characteristics: they carefully analyze lane suitability before committing, they build strong relationships with IMCs or direct rail providers, they manage equipment logistics proactively, and they set realistic customer expectations about transit times.
The mistakes happen when shippers treat intermodal like truck shipping—expecting same-day scheduling, 99% on-time delivery to narrow windows, and truck-like flexibility. Intermodal operates differently. Respect those differences and manage operations accordingly.
Start small. Pick your best lanes—long distance, consistent volume, transit-tolerant freight. Run them for 90 days. Learn the rhythms of intermodal service in those lanes. Build confidence in your operations and your customers’ acceptance of the service.
Then expand. Add lanes incrementally. Don’t convert your entire network overnight. Steady expansion based on documented success in initial lanes creates sustainable intermodal programs.
The opportunity is significant. Most shippers could convert 20-30% of their freight to intermodal if they made the operational adjustments required. At 30% savings per shipment, that translates to 6-9% reduction in total freight spend. For a company spending $10 million annually on over-the-road freight, that’s $600,000-$900,000 in annual savings.
Add the sustainability benefits—measurable carbon reduction that supports corporate climate goals while actually reducing costs—and intermodal represents perhaps the best win-win opportunity in logistics today.
The infrastructure exists. The service providers are ready. The cost savings are waiting. What’s required is the knowledge to use intermodal effectively and the willingness to make the operational adjustments that enable its success.
Whether you’re shipping 10 containers monthly or 1,000, intermodal economics work the same. The principles apply regardless of company size. Start analyzing your lanes. Identify your opportunities. Build relationships with intermodal providers. Test the service. Then expand based on success.
The combination of dramatic cost savings and significant carbon reduction makes intermodal one of the most strategic decisions in transportation management. Companies mastering intermodal build competitive advantages that compound annually through lower costs and demonstrated sustainability leadership that increasingly matters to customers, investors, and employees.